Bubbler: Monitoring homebrew CO2 production with arecord and Python
A couple of weeks back I was thinking about monitors and sensors and had a crazy idea: it ought to be possible to gather stats on how well my plonk is fermenting by attaching a mic to the airlock and counting the bubbles. So in a moment of enthusiasm I ordered a cheap lapel microphone from eBay and forgot all about it… until Saturday morning when it finally arrived in the post.
Time for some fun!
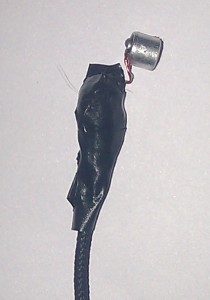
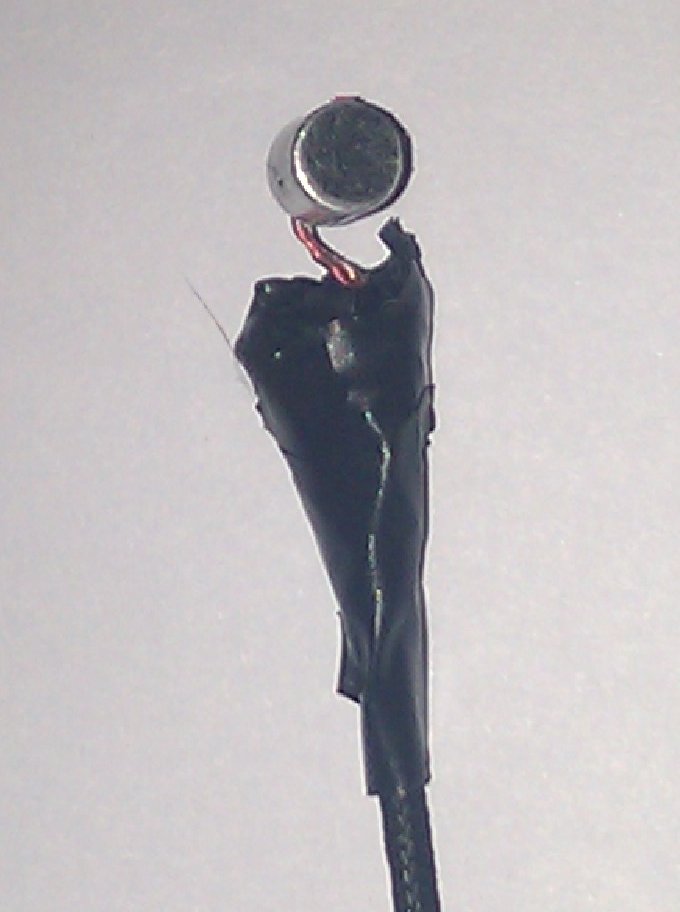
The first thing I did was break the plastic housing off the mic and exposed the sensor, I snipped off the headphone socket and taped up the rest. It’s not the prettiest bit of electrical tape you’re likely to see, but it does the job:
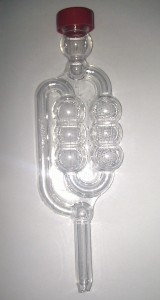
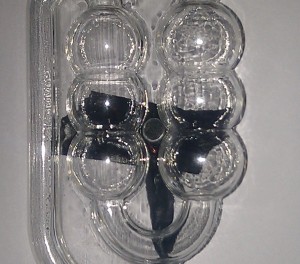
I then taped the mic to the airlock roughly at the area where the bubbles will be, then taped the whole thing up to make it a bit more water-resistant.
Okay, now onto the fun bit: writing the software :)
The easiest way to get sound from the mic port is to use ALSA‘s arecord, which comes as part of alsa-utils and should already be installed on your distro. Run amixer from the command line to find the correct input and unmute it if required, but in most cases just running arecord will work. I set my volume levels to be 100% (unamplified) as I want to be the only person messing with the data.
I’m after a raw stream of data without any of that WAV header nonsense, so throwing a stream of raw longs to stdout looks a little like this:
gaz@beast:~$ arecord --format=S32_LE --file-type=raw
The next task is detecting the bubbles in this raw data. The mic is touching the airlock so the bubbles are very loud and high pitched, so plugging in a high pass filter might help get rid of any background noise. I found that using Audacity’s high pass filter managed to keep the bubble track intact while filtering out most of the the sound of a vacuum cleaner, which is pretty impressive. I didn’t write my own high pass filter as it seems to work okay without one, maybe I’ll make an FFT-based one in the future.
For the moment though, I simply defined a bubble-part as a volume reading that is two standard deviations away from the mean, where the mean is taken by summing the distance of each sample from the base line; waves always add up to 0, so we need an absolute measurement from the base line or the average will always be 0. If this bubble part is more than t milliseconds from the last one, then we have a new bubble.
My limited testing shows that the bubble count appears to be roughly right even when I’m playing music in the background, but it will probably need some tweaks before it works in all cases. So far it’s only been tested with my 25 litre plastic wine fermenter, so I have no idea how it will perform on demijohns. I can think of a number of things that are wrong with the algorithm too.
For a start it’s adaptive, so if you simply unplug the cable then the odd bubble will be detected. A minimum bubble length may help here. Secondly, the averages are taken from the last listening period so it’s all dependent on the length of this window, moving averages might be better, but would be more processor intensive (as if Python wasn’t processor intensive enough) and I have no idea what that does statistically, but I imagine it’s not good from a purist perspective. Finally, it’s using average volume of each |sample value| but it actually uses peak levels to detect bubbles, so I guess that it ought to be using the maximum |sample value| over N samples where N is equivalent to some minimum frequency.
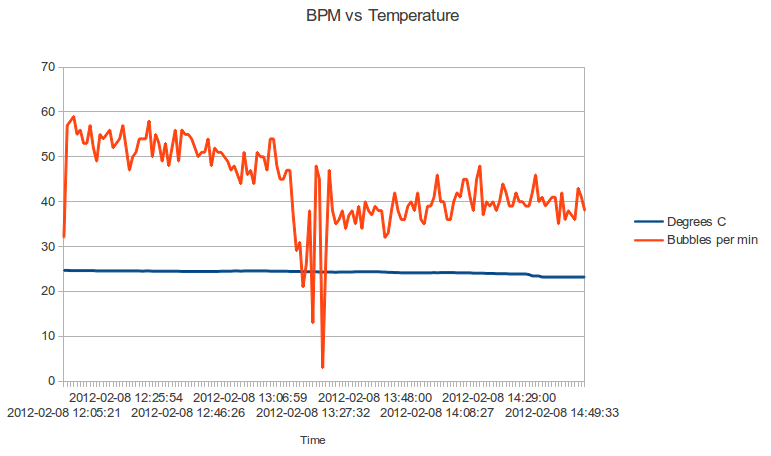
Ignoring all that it appears to work okay. Here’s a graph that shows it in action along with my thermometer, the dip is caused by me dismantling it while taking the photos above.
You can download or fork the the code over on github.
Happy brewing!